AARO "Go Fast" UAP Case Resolution Report
Summary
AARO's 'Go Fast' case resolution (6 February 2025). AARO assesses with high confidence that the 2015 Navy infrared object did not move at anomalous speeds; its apparent high speed is an optical effect (motion parallax).
Common questions
- What did AARO conclude about the speed of the Go Fast object?
- The AARO report assesses with high confidence that the object did not move at anomalous speeds. Its altitude was approximately 13,000 feet and its wind-compensated speed roughly 2 m/s (5 mph) to 41.3 m/s (92 mph).
- Why did the Go Fast object appear to move so fast in the video?
- AARO attributes the apparent high speed to motion parallax — an optical effect by which a slow-moving object viewed from a moving sensor platform appears to move much faster.
- What is the status of the Go Fast case?
- The report states that AARO could not definitively identify the object but found it displayed no anomalous performance characteristics. The case is classified as resolved (attributed) in AARO's case-resolution series.
Source & Classification
Record metadata
- Record type
- Report landing
- Decade
- 2010s
- Review status
- published
- Publication status
- published
Official source link
https://www.aaro.mil/UAP-Cases/UAP-Case-Resolution-Reports/Preservation copy (PDF) ⬇ · 2.1 MB · 26 pp A local preservation copy of this public-domain U.S.-government document. The official source above is authoritative.
Documents are linked to their official source pages, with a local preservation copy of the public-domain U.S.-government document where available; the official source is authoritative. Videos are linked, not hosted. Copyright and license notes are recorded per source.
Topics
Cite this record View collection →
All-domain Anomaly Resolution Office (AARO). "AARO "Go Fast" UAP Case Resolution Report". 2010s. Official source: https://www.aaro.mil/UAP-Cases/UAP-Case-Resolution-Reports/. Cataloged by the independent UAP Records Archive (not an official or government source): https://uap-archive.org/uap/records/aaro-gofast-case-resolution/.
APA
All-domain Anomaly Resolution Office (AARO). (2010s). AARO "Go Fast" UAP Case Resolution Report. https://www.aaro.mil/UAP-Cases/UAP-Case-Resolution-Reports/
MLA
All-domain Anomaly Resolution Office (AARO). "AARO "Go Fast" UAP Case Resolution Report." 2010s, https://www.aaro.mil/UAP-Cases/UAP-Case-Resolution-Reports/.
Chicago
All-domain Anomaly Resolution Office (AARO). "AARO "Go Fast" UAP Case Resolution Report." 2010s. https://www.aaro.mil/UAP-Cases/UAP-Case-Resolution-Reports/.
BibTeX
@misc{uaprecords_aaro-gofast-case-resolution,
  title  = {AARO "Go Fast" UAP Case Resolution Report},
  author = {All-domain Anomaly Resolution Office (AARO)},
  year   = {2010s},
  howpublished = {Official source: https://www.aaro.mil/UAP-Cases/UAP-Case-Resolution-Reports/},
  note   = {Cataloged by the independent UAP Records Archive — not an official or government source},
  url    = {https://uap-archive.org/uap/records/aaro-gofast-case-resolution/}
}
Embed this record
Copy this HTML to embed the record card with attribution on your site.
<figure style="max-width:600px;margin:0;"> <a href="https://uap-archive.org/uap/records/aaro-gofast-case-resolution/"><img src="https://uap-archive.org/og/records/aaro-gofast-case-resolution.png" alt="AARO "Go Fast" UAP Case Resolution Report — UAP Records Archive" width="600" style="width:100%;height:auto;border:0;" loading="lazy"></a> <figcaption style="font-size:13px;line-height:1.5;">All-domain Anomaly Resolution Office (AARO). "AARO "Go Fast" UAP Case Resolution Report". 2010s. Official source: https://www.aaro.mil/UAP-Cases/UAP-Case-Resolution-Reports/. Cataloged by the independent UAP Records Archive (not an official or government source): https://uap-archive.org/uap/records/aaro-gofast-case-resolution/. <a href="https://uap-archive.org/uap/records/aaro-gofast-case-resolution/">View record →</a></figcaption> </figure>
Related records
Evidence
License note (source-level)
AARO content is US Department of Defense work, generally public domain under 17 U.S.C. §105. DoD seal and identity usage is governed by 18 U.S.C. §701 and DoD Directive 5410.20 and is not used by this archive. License treatment for specific linked documents will be assessed before any indexed or monetized release.
Archivist note
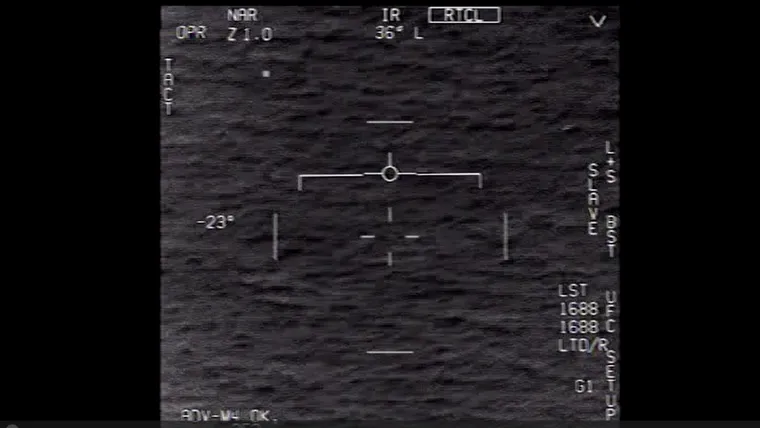
AARO’s case resolution report for the “Go Fast” event, dated 6 February 2025. The video was recorded in January 2015 by a U.S. Navy F/A-18F pilot using a Forward Looking Infrared (FLIR) sensor off the eastern coast of Florida, and was officially released by the Department of Defense in 2020. The case is one of the three Navy videos most often discussed in public UAP coverage (alongside “FLIR1/Tic Tac” and “Gimbal”).
According to AARO, it assesses with high confidence that the object did not move at anomalous speeds: its altitude was about 13,000 feet and its wind-compensated speed about 2 m/s (5 mph) to 41.3 m/s (92 mph), with the apparent high speed attributable to motion parallax (a moving-sensor optical effect). The report includes a technical appendix detailing the FLIR-video geometry, wind modeling, and calculations.
The full English text below is machine-extracted from the linked PDF for reference; the original document is authoritative. This archive links the official source and an archive snapshot, and does not reproduce the DoD or AARO visual identity.
Full text (machine-extracted)
Uncertainty / Limits
Archive state (this release)
- Official source aaro.mil ↗
- Archived 2025-02-10 ↗
- Added to archive
- Last revised
- Record status
- Official link verified
- Review status
- published
- Publication status
- published
- Local copy
- Preservation copy hosted on this site
- Summary
- Published
- Translation
- Published — View in 中文 →
Verify this document (SHA-256)
This archive recorded the SHA-256 checksum of the source PDF. Download the document and recompute its checksum — a matching value means the file is byte-for-byte identical to the one this record cites:
SHA-256 · e18c3e6bd8ba94e96e0bb77160134ff01d3978f595d3b425ecb4ebd8523cc834
Preservation copy: /uap/docs/aaro-gofast-case-resolution.pdf ↗
# macOS / Linux / WSL
sha256sum aaro-gofast-case-resolution.pdf

# Windows PowerShell
Get-FileHash aaro-gofast-case-resolution.pdf -Algorithm SHA256
A matching checksum means the file is byte-for-byte identical to the archived document. It does not verify the truth of any statement in the document — only the integrity of the file.